p53 conference poster · Supplementary analysis
What short restrained processing changes in generative p53 ensembles
A six-model exploratory pilot of reconstruction, restrained minimization, and short molecular dynamics for p53 residues 1–28.
Exploratory supplementary pilot · Benchmark manuscript resubmitted
Short answer
Reconstruction followed by restrained minimization and short molecular dynamics (MD) changed chemical-shift agreement substantially. Backbone amide-proton (HN) error decreased across all six generative structure models (GSMs), while heavy-atom responses were mixed. This processing-sensitivity pilot is not a universally validated refinement method or a substitute for independent experimental validation.
The processing workflow
- GSM coordinates
- Backbone extraction
- PULCHRA reconstruction
- Hydrogen addition
- Restrained minimization
- 100 ps restrained MD
- Evaluation
The source script selects MDTraj backbone atoms. No new coarse-grained (CG) simulation precedes this reconstruction, and this is not a controlled Cα-only ablation. It is related to, but distinct from, the CALVADOS CG reconstruction pipeline: this six-GSM pilot starts from generated coordinates. The primary benchmark’s GSM structures were not minimized or relaxed.
Processing conditions
- OpenMM with
amber14-all.xml(AMBER ff14SB protein parameters). - Vacuum, no nonbonded cutoff, and hydrogen-bond constraints.
- Energy minimization: a maximum of 500 iterations.
- Langevin-middle dynamics at 300 K, friction 1 ps⁻¹, timestep 2 fs, 50,000 steps (100 ps).
- Cα restraints to each input conformation use
k × [(x−x₀)² + (y−y₀)² + (z−z₀)²], with k = 1000 kJ mol⁻¹ nm⁻². Finite restraints limit motion; they do not mathematically fix backbone coordinates.
These conditions are not explicit-solvent or physiological sampling, full equilibration, or a guarantee against compaction artifacts.
NMR agreement before and after processing
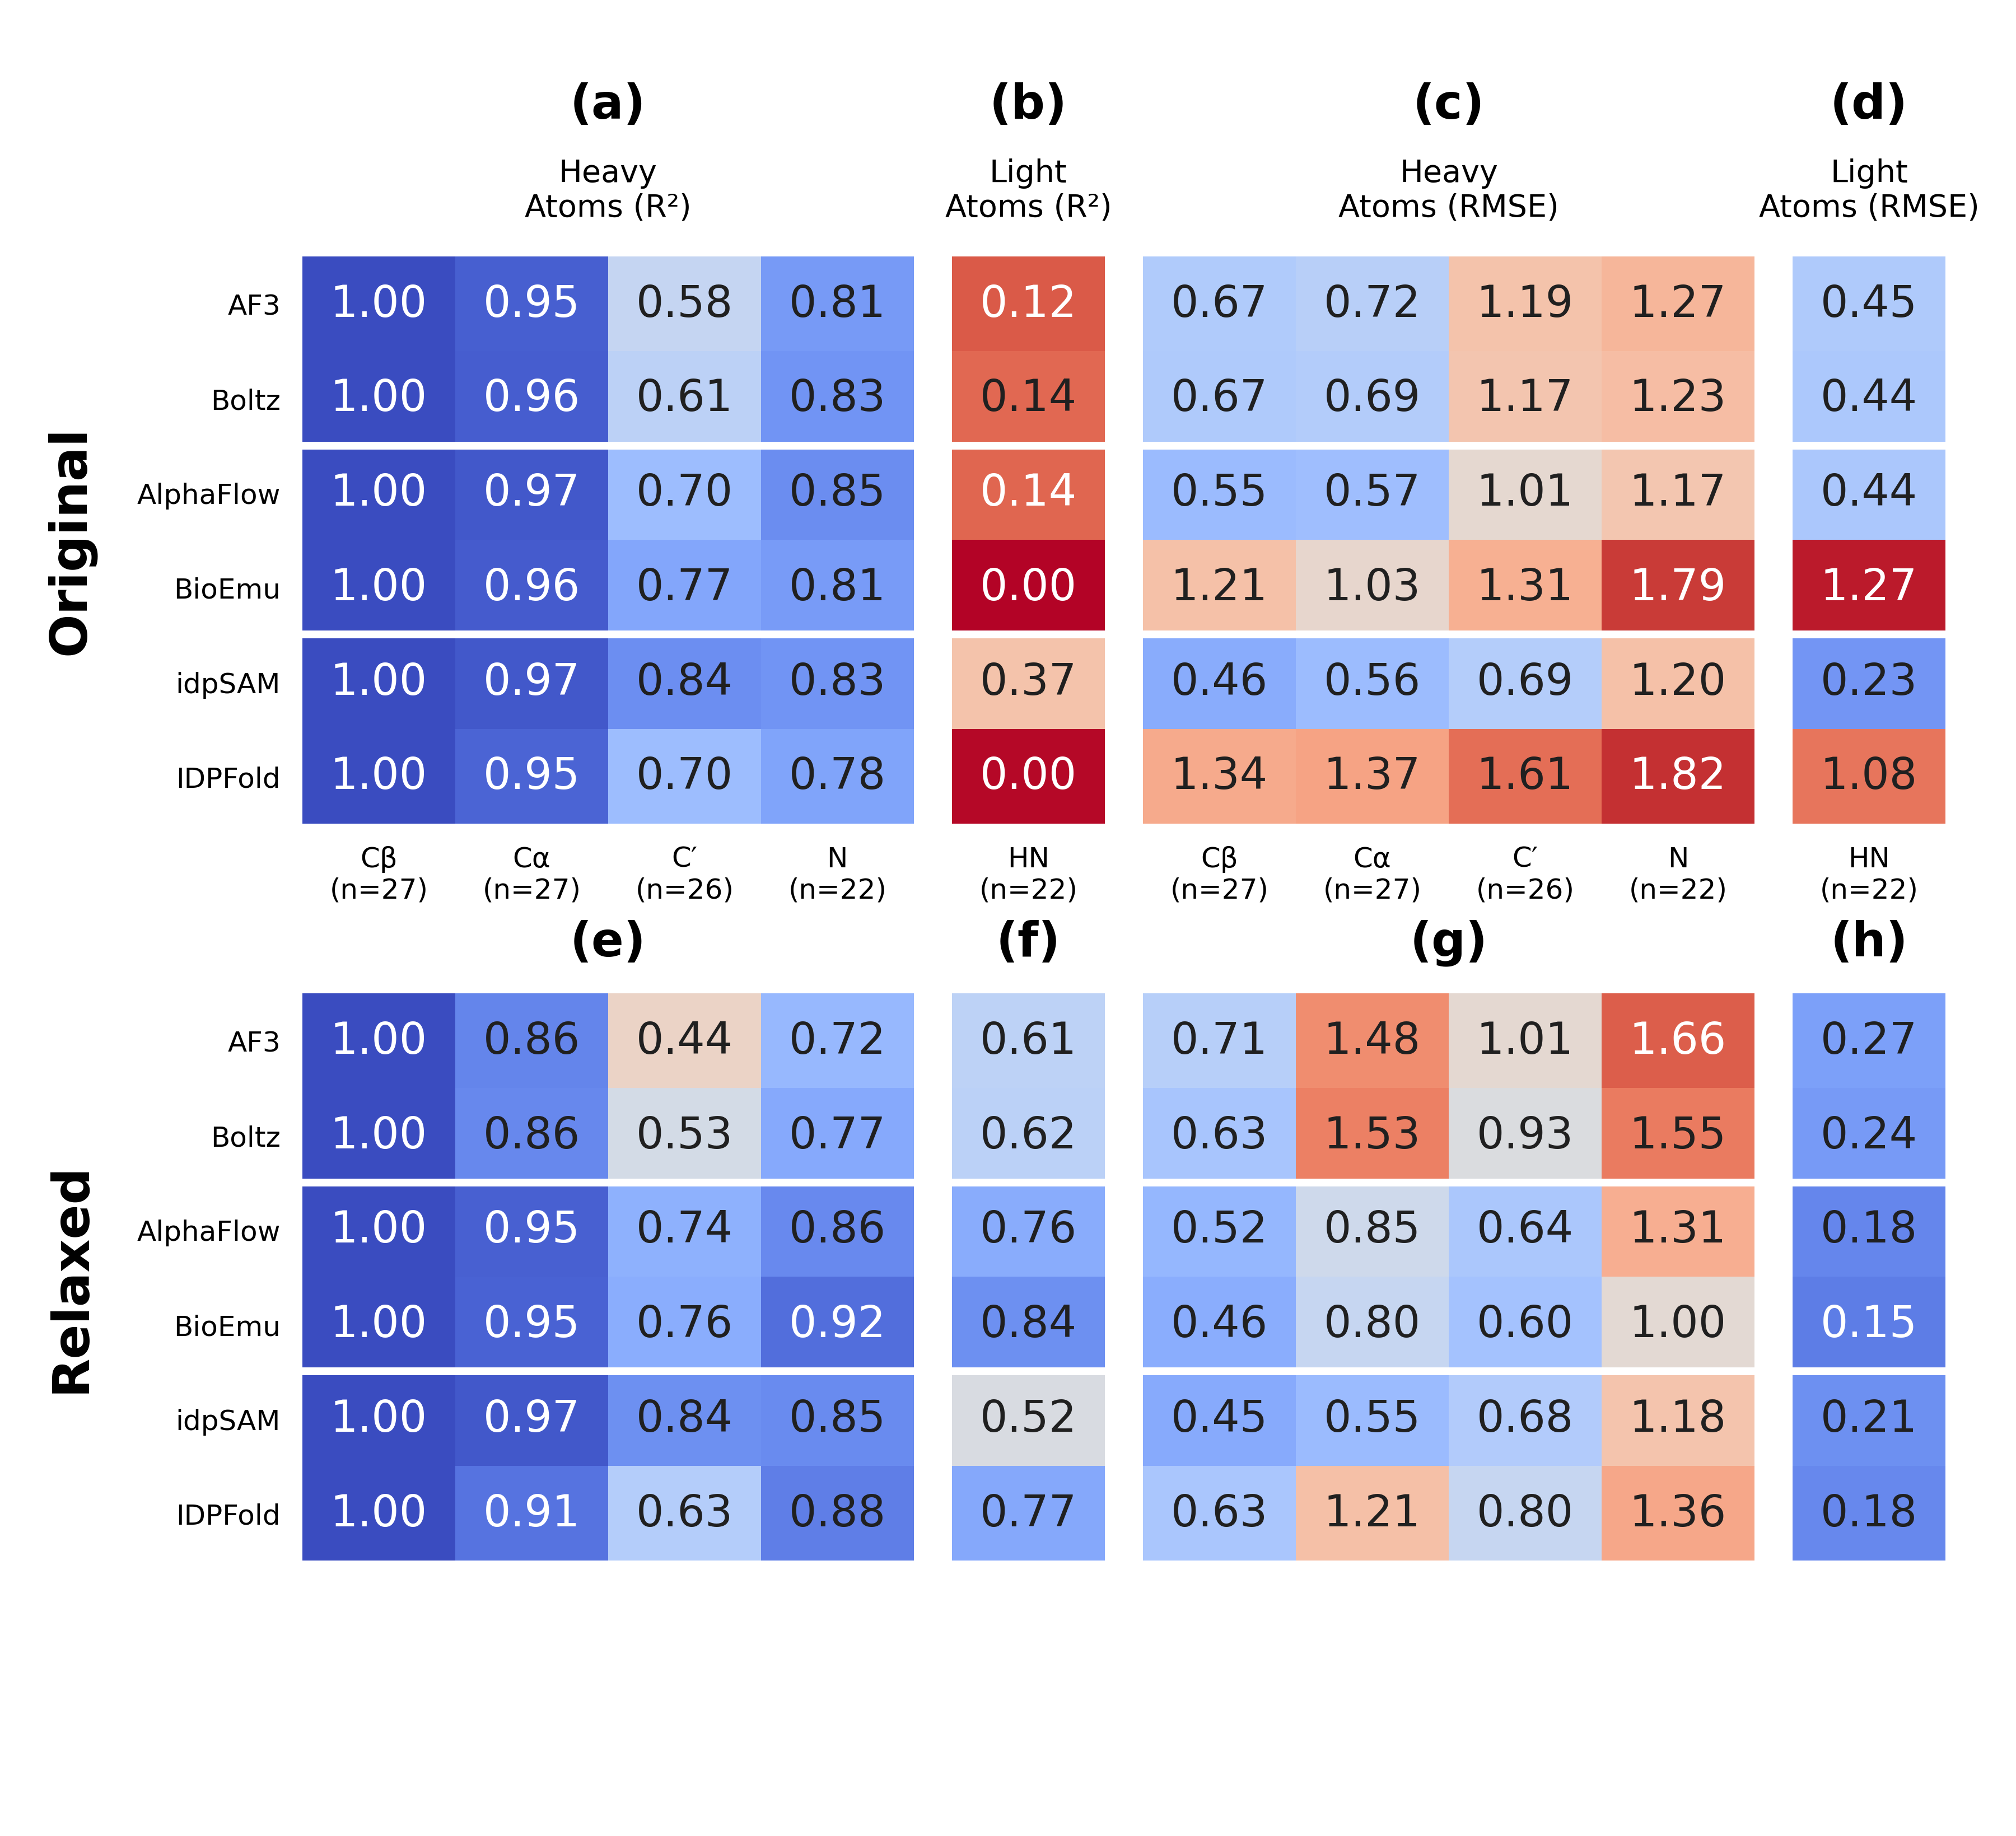
Nuclear magnetic resonance (NMR) predictions are compared using root-mean-square error (RMSE), in parts per million (ppm). Values below come directly from the exact heatmap TSV, using identical residue/atom assignments across methods and states. “Processed” corresponds to “Relaxed” in the supplied tables and figures.
| Model | HN original (ppm) | HN processed (ppm) | Cα original (ppm) | Cα processed (ppm) |
|---|---|---|---|---|
| AlphaFold3 | 0.453 | 0.268 | 0.718 | 1.477 |
| Boltz-2x | 0.445 | 0.245 | 0.687 | 1.529 |
| AlphaFlow | 0.441 | 0.183 | 0.574 | 0.848 |
| BioEmu | 1.271 | 0.150 | 1.031 | 0.800 |
| idpSAM | 0.233 | 0.210 | 0.563 | 0.551 |
| IDPFold | 1.077 | 0.185 | 1.375 | 1.212 |
Chemical-shift agreement
Positional dispersion
Backbone geometry
Structural sample counts
The following counts apply to the RMSF comparison in this pilot. They are not the primary benchmark’s replenished 1,000-structure counts. Original and processed ensembles can differ in membership; equal counts do not establish frame pairing.
| Model label | Original conformers | Processed conformers |
|---|---|---|
| AF3 | 1002 | 1000 |
| Boltz | 1148 | 1148 |
| AlphaFlow | 1000 | 1000 |
| BioEmu | 960 | 959 |
| idpSAM | 1000 | 998 |
| IDPFold | 3000 | 2998 |
What changed?
HN errors decreased for all six models, particularly BioEmu and IDPFold. Cα RMSE increased for AlphaFold3 and Boltz-2x, demonstrating why improved proton agreement does not establish uniform improvement.
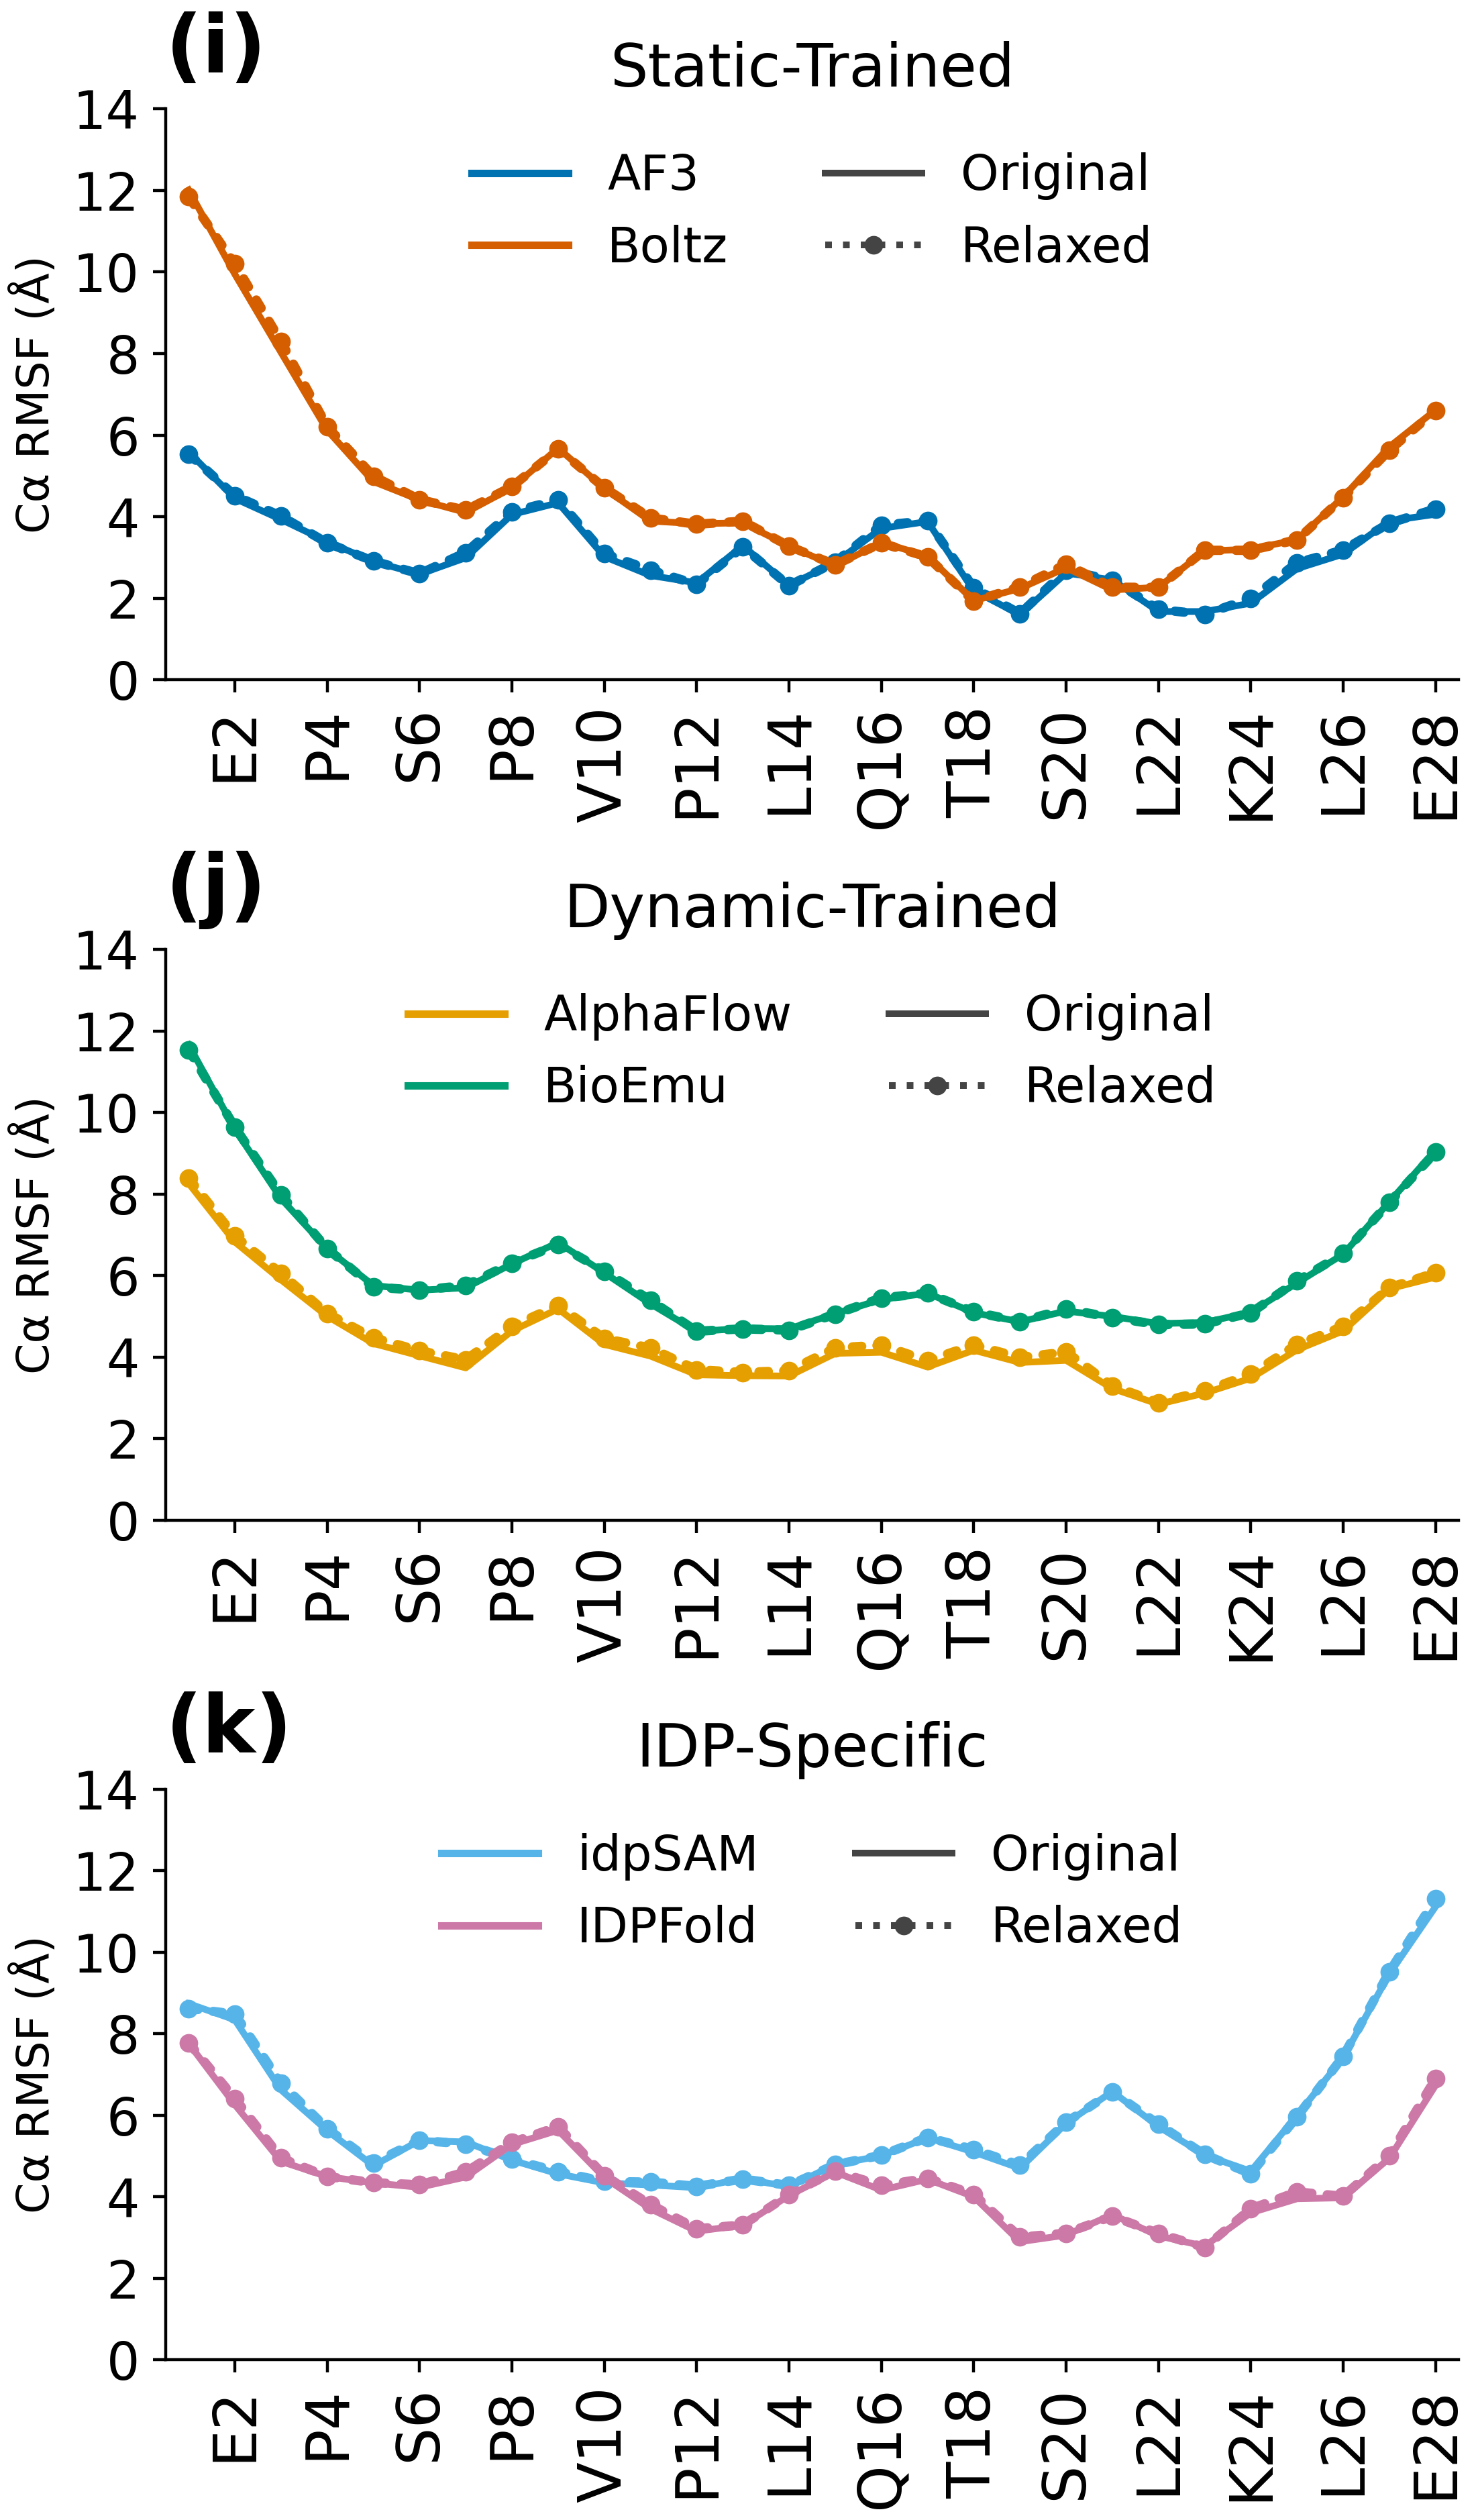
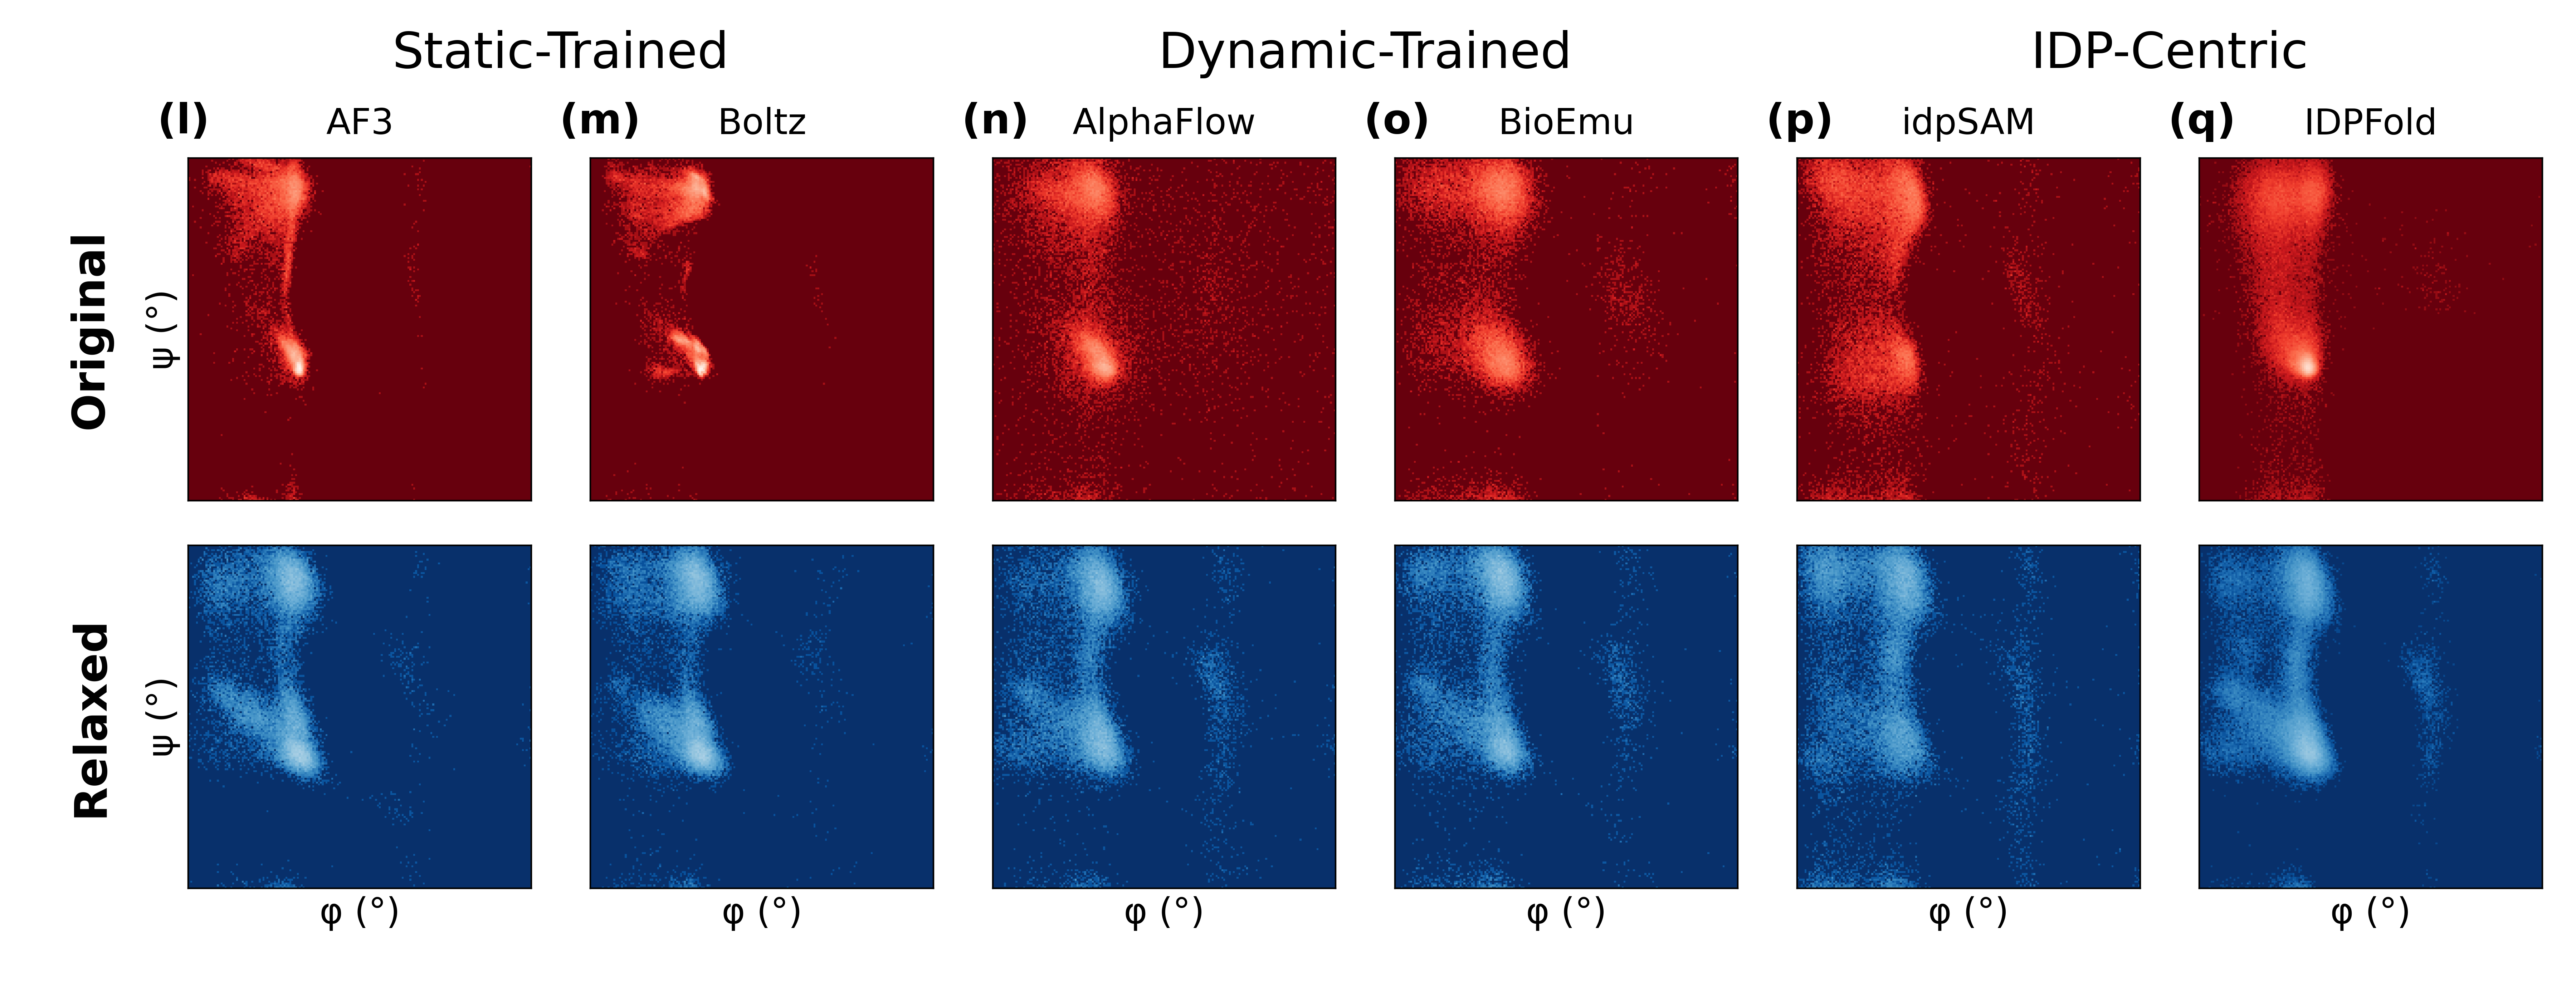
Mean absolute residue-wise RMSF changes were approximately 0.035–0.121 Å across methods; the largest single change was approximately 0.270 Å. These are limited changes in positional dispersion, not proof that every structural feature was preserved. The Ramachandran plots retain the main populated regions without establishing unchanged populations.
Interpretation and limitations
This comparison tests reconstruction, hydrogen addition, minimization, and restrained MD together. Improvements cannot be assigned solely to short MD or model architecture. Incomplete original atomic representations, particularly for IDPFold, allow reconstruction and protonation to contribute substantially.
The experimental reference, BMRB 17760, measures wild-type p53 residues 1–93, whereas the modeled/analyzed fragments contain 1–28. This is not construct-matched validation. The reference conditions are pH 7.4, 293 K, and ionic strength 175 mM; the primary benchmark instead uses BMRB 51984.
Chemical shifts use equal conformer weights and no fitted referencing offset. The common assignment set totals 124: 27 Cβ, 27 Cα, 26 C′, 22 N, and 22 HN. These are residue/atom assignments, not conformer counts. Missing Hα assignments are not imputed. Squared Pearson correlation measures association and differs from predictive R²; nuclei are not pooled into one score.
There are no uncertainty intervals or significance tests establishing universal improvement. Neither HN agreement nor a stable-looking RMSF profile demonstrates full ensemble accuracy, equilibrium populations, binding mechanisms, or complete equilibration. Original and processed structural samples are not assumed to be frame-paired.
Assess reconstruction, filtering, and relaxation together against relevant observables. An improvement for one nucleus motivates further validation; it is not a universal method ranking or a validated production pipeline.
Full overview figure
Downloads and related study
- nmr_before_after_alignment.tsv
- nmr_before_after_changes.tsv
- nmr_before_after_metadata.json
- nmr_before_after_metrics.tsv
- nmr_heatmap_data_v11.tsv
- ramachandran_summary_v1.tsv
- rmsf_alignment_v2.tsv
- rmsf_plot_data_v2.tsv
The study dataset accompanies the p53 generative structure model benchmark. This does not imply that every additional website pilot asset or script is deposited there. Downloadable originals on this page are preserved unchanged; asset checksums are available for verification.
Related analysis: Explore the companion study.
Study authors: Michael Bakker, Oskar Svensson, and Marie Skepö.
Contact: Michael Bakker. Back to research.